Exploring the impact of the U.S. Data Center Boom: An Interactive Dashboard
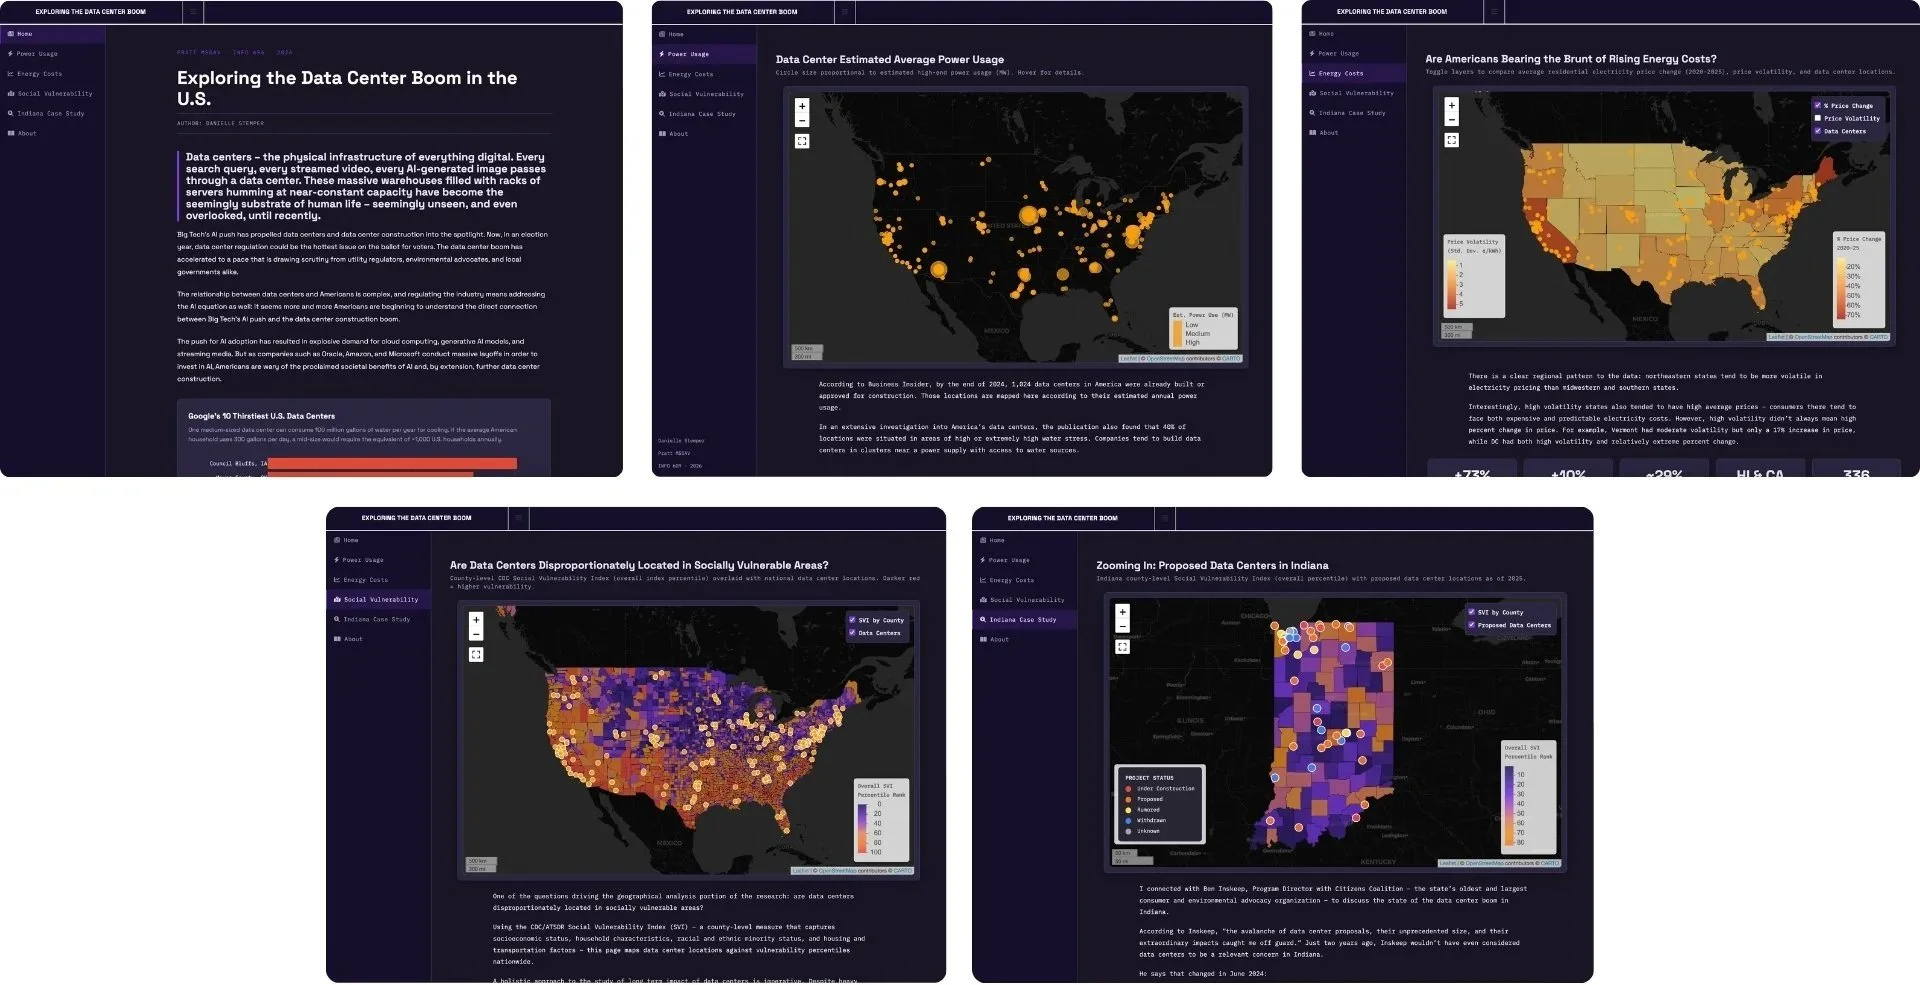
Data centers – the physical infrastructure of everything digital. Every search query, every streamed video, every AI-generated image passes through a data center. These massive warehouses filled with racks of servers humming at near-constant capacity have become the seemingly substrate of human life – seemingly unseen, and even overlooked, until recently. The goal of this project is to capture how Americans are reacting to the data center boom and understand what the future holds for the state of data centers in the U.S.
01 Challenge: Visually capture key players, socioeconomic factors, and current status of and related to data center activity in the U.S.
What started as a project to understand existing AI policy at different government levels, turned into a exploration into the data center boom that’s rapidly spread across the U.S. Big Tech’s AI push has propelled data centers and data center construction into the spotlight. Now, in an election year, data center regulation could be the hottest issue on the ballot for voters. The data center boom has accelerated to a pace that is drawing scrutiny from utility regulators, environmental advocates, and local governments alike.
Amidst the data center construction push, efforts to fight back have been spreading at municipal levels: neighborhood groups coming together to vote against data center proposals, local governments passing construction moratoriums, and increased federal-level activity to develop better AI regulation overall. Regulation and policy-tracking projects by independent organizations and research groups have also been fighting to understand and uncover data center activity.
02 Solution: a dashboard to capture narrative and visuals
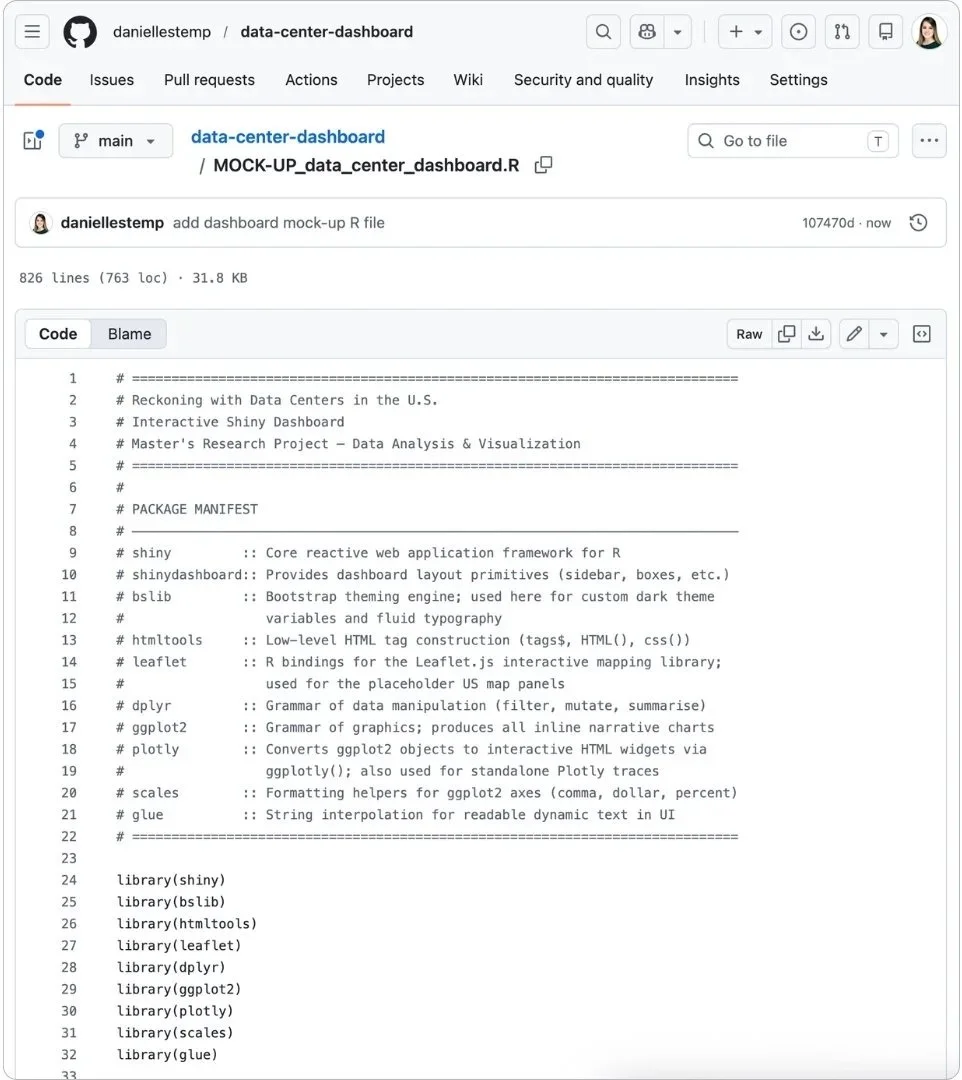
The relationship between data centers and energy in the US is complex, so I set out to capture various aspects of the relationship in a central dashboard. Using R and libraries including shiny, tidyverse, sf, tigris, dplyr, and leaflet, I’m building out a user-friendly, functional dashboard that enables viewers to interact with information and data related to data centers in the US. Click here to explore the dashboard.
03 Process: Media audit, literature review, data exploration & analysis
Media audit of related key themes & topics
My research on key themes and topics discussed by the media has revealed the following as the most frequently covered aspects of data centers and energy in the US:
Artificial Intelligence (AI) literacy — programs, definitions, and fields of application
Data center energy use — proponents, concerns, regulation efforts
AI tools & applications — opponents, Big Tech promotion, lack of policy and regulation
Data center development — growth hot spots, resident opposition efforts, attempts to regulate
Outreach & conversations with industry players
These companies seem to follow our every move online, but who’s tracking them? I’ve come across a number of individuals, groups, and organizations working to capture various aspects of the data center boom. I conducted industry research and outreach to individuals and organizations — heavily involved in activities such as collecting data around local data center activity and tracking data center and AI policy — in order to hear first-hand accounts and reactions to the data center boom.
Literature review
My literature review includes a deeper dive into the above topics to better understand key players, trends, and regulations efforts. Every bit of information online is stored in data centers, but information around data center locations themselves – existing locations, construction plans, even the businesses behind them – is precarious and sporadic at best.
Data exploration & analysis
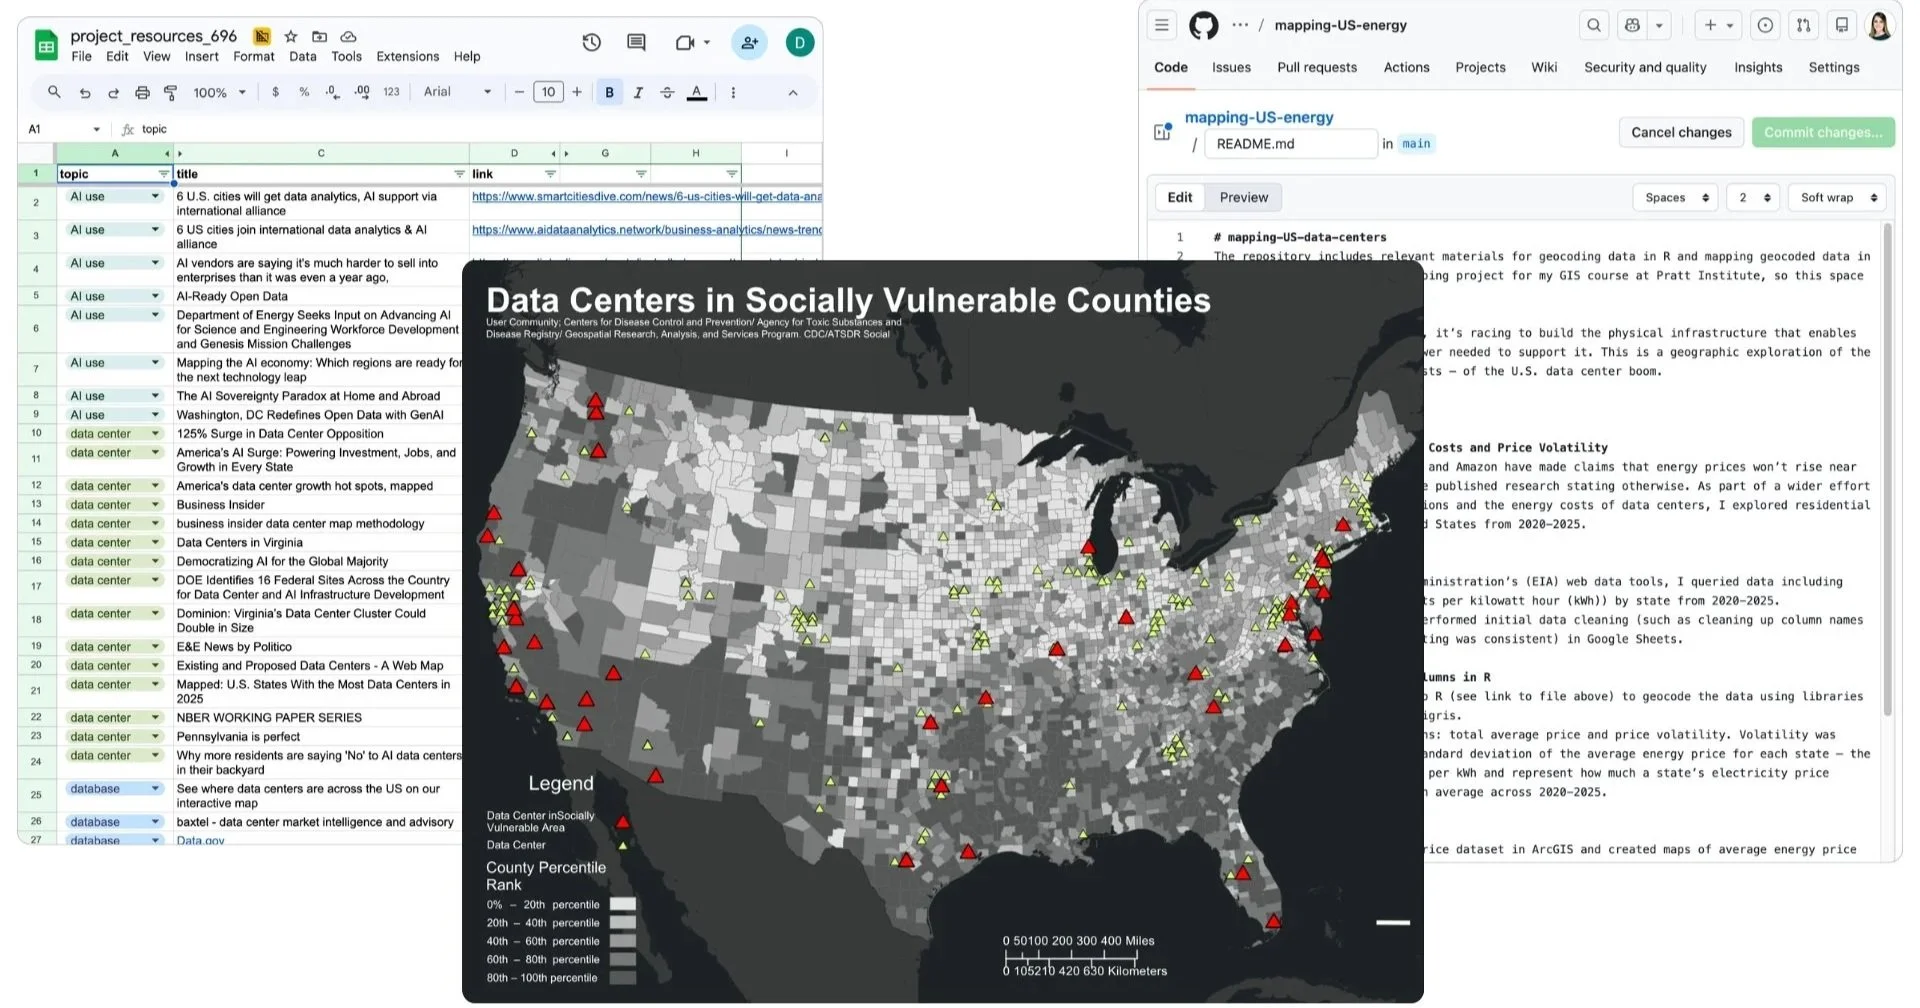
Geographic analysis of various socioeconomic factors is one of the ways to visualize the potential impact data centers are having on the U.S. Exploratory analysis has included efforts to geocode the datasets in order to map them with the appropriate libraries and processes in R and ArcGIS. Key data sources I’ve analyzed:
U.S. Energy Information Administration - residential energy prices and price volatility
Business Insider - confirmed data center locations based on internal research efforts
Center for Disease Control and Prevention and Agency for Toxic Substances and Disease Registry: 2022 Social Vulnerability Index mapping most socially vulnerable geographic areas in the U.S.
04 Reflection & Findings
Reigning in the project focus
The sheer amount of information around data centers was an intimidating prospect, especially given the legal and cultural nuances between states, cities, and towns impacted by existing, planned, or proposed data center activity. It took great discipline to remain within the scope of this project, which ended up requiring ample flexibility and a willingness to go wherever the research seemed to lead. After all, the project started as an analysis of AI policy at different government levels, and turned into a full-blown exploration into data center activity across the U.S.
Capturing narrative and nuance visually
There are so many different aspects to this issue, and I wanted the ability to share this information in an organized and intuitive format. An interactive dashboard seemed like the right fit.
The relationship between data centers and Americans is complex, and regulating the industry means addressing the AI equation as well: it seems more and more Americans are beginning to understand the direct connection between Big Tech’s AI push and the data center construction boom.
The push for AI adoption has resulted in explosive demand for cloud computing, generative AI models, and streaming media. But as companies such as Oracle, Amazon, and Microsoft conduct massive layoffs in order to invest in AI, Americans are wary of the proclaimed societal benefits of AI and, by extension, further data center construction.
Library imports, summary of function sections, and documentation
INFO 696 Advanced Projects in Visualization
Professor Benjamin Zweig
Pratt Institute School of Information | Spring 2026