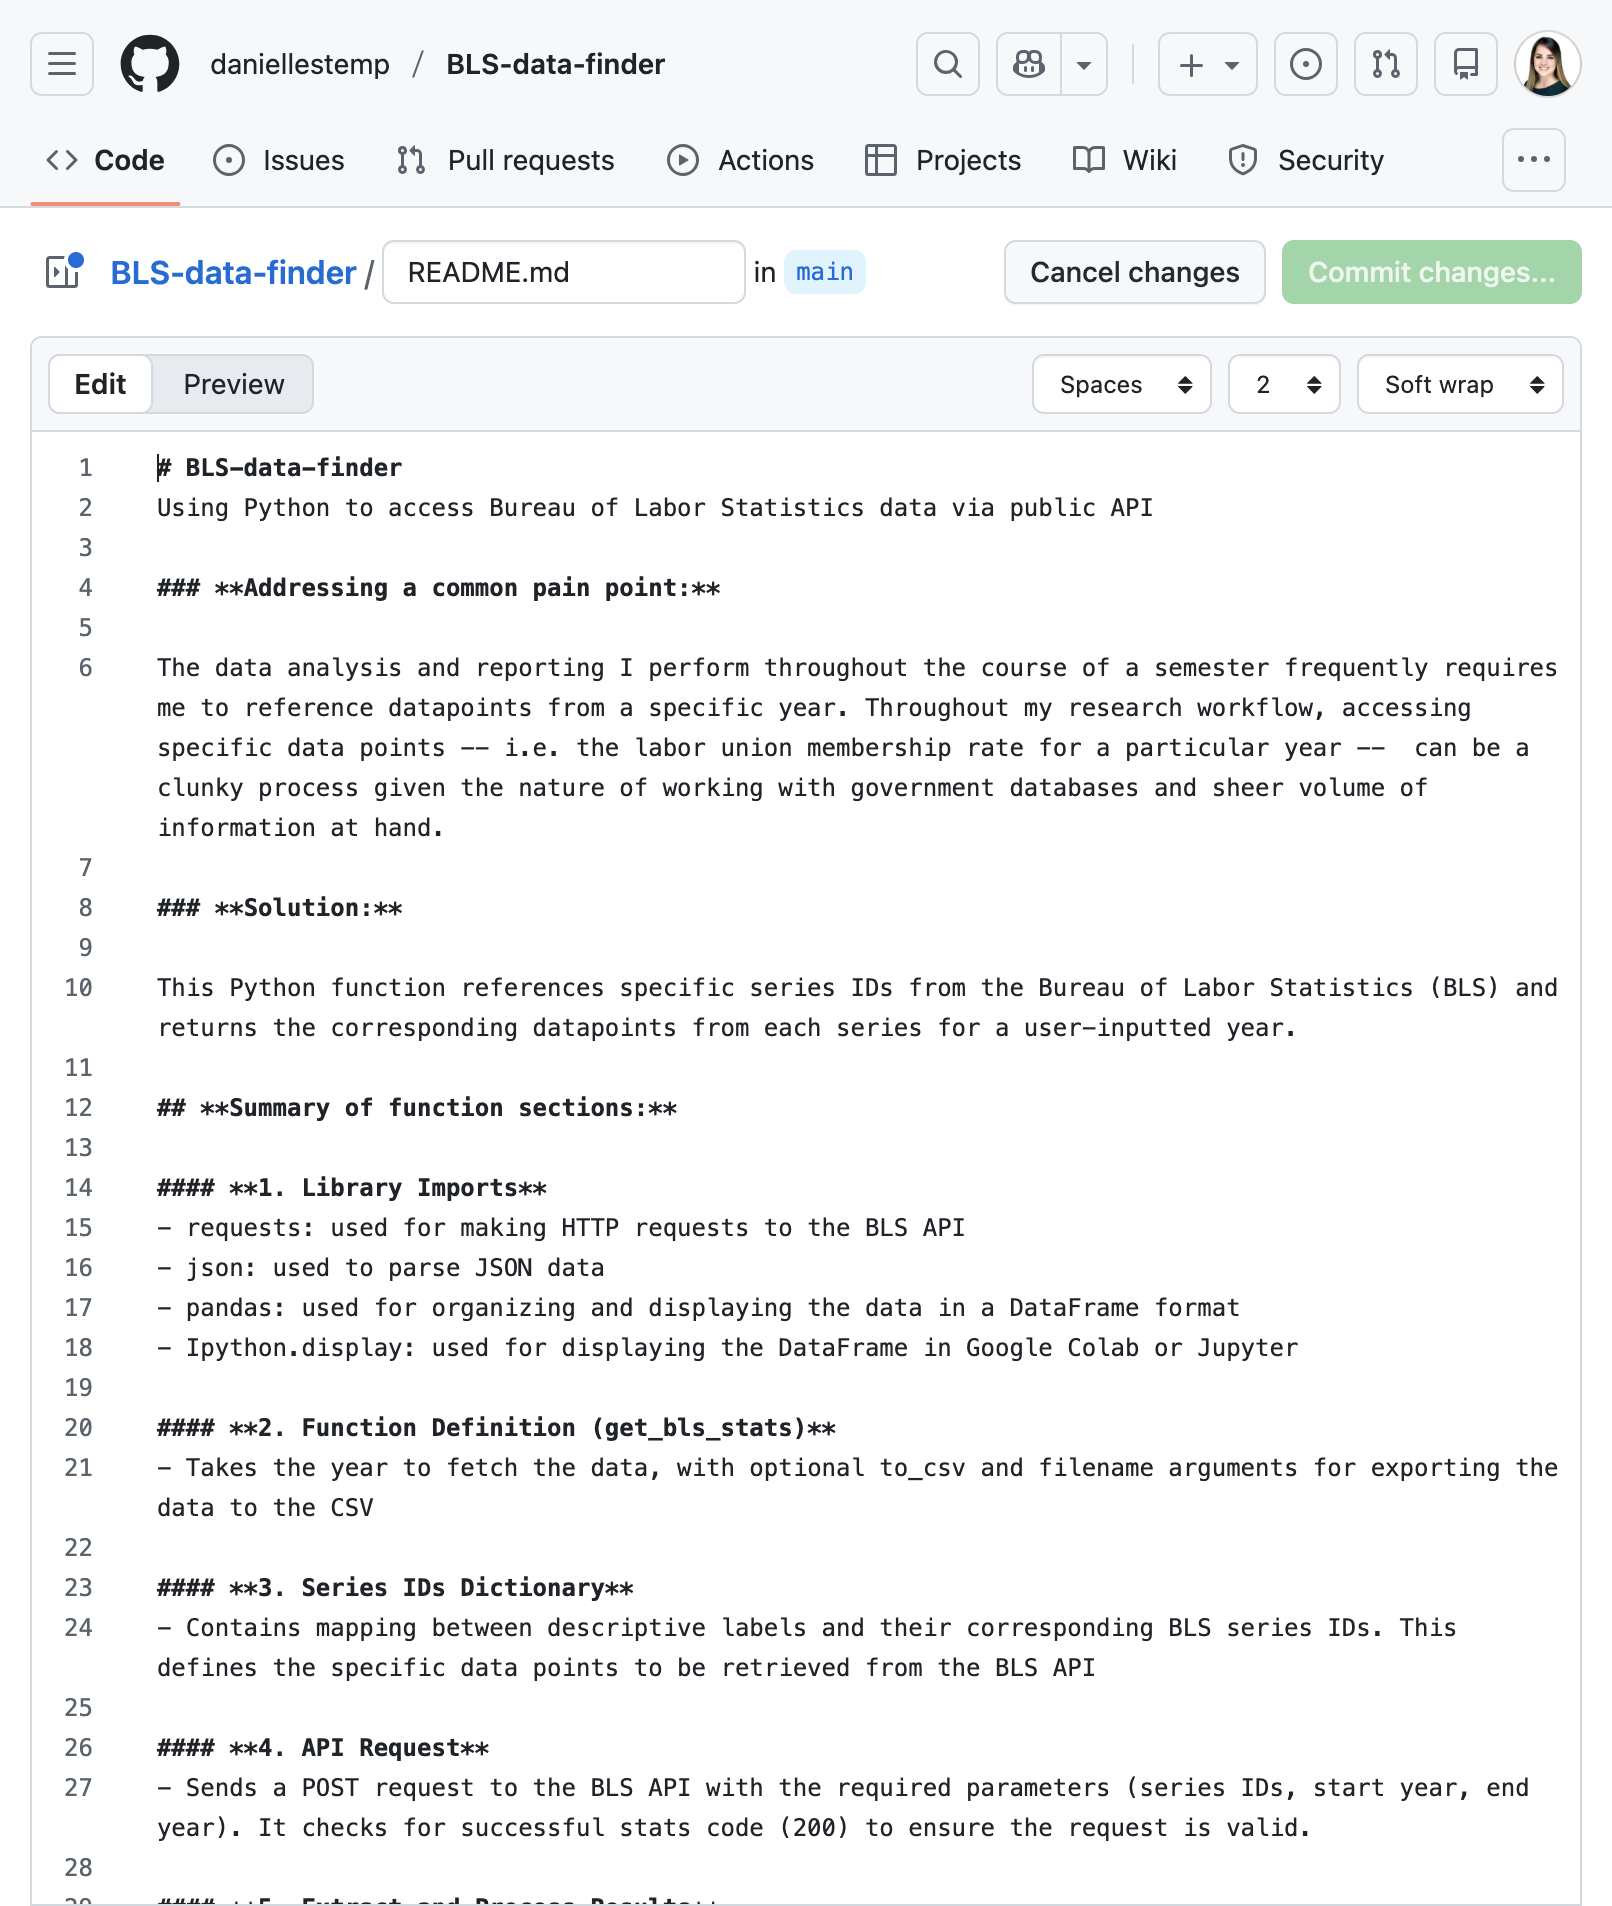
Simplifying Research Workflows with get-bls-data
Throughout my personal research workflow, accessing specific data points can be a clunky process given the nature of working working with data. My function — get-bls-data — uses Python to quickly access Bureau of Labor Statistics (BLS) data.
01
Challenge
02
Solution
03
Process
04
Reflection
01 Challenges
Navigating clunky data tools, massive databases, and numerous spreadsheets
Finding one data point for a particular variable is surprisingly challenging, yet the task is a key component of data analysis and reporting. Even the most organized analysts can struggle to navigate clunky government databases and organize any number of spreadsheets throughout their research workflow.
02 A Simple Solution
Reducing workflow disruptions
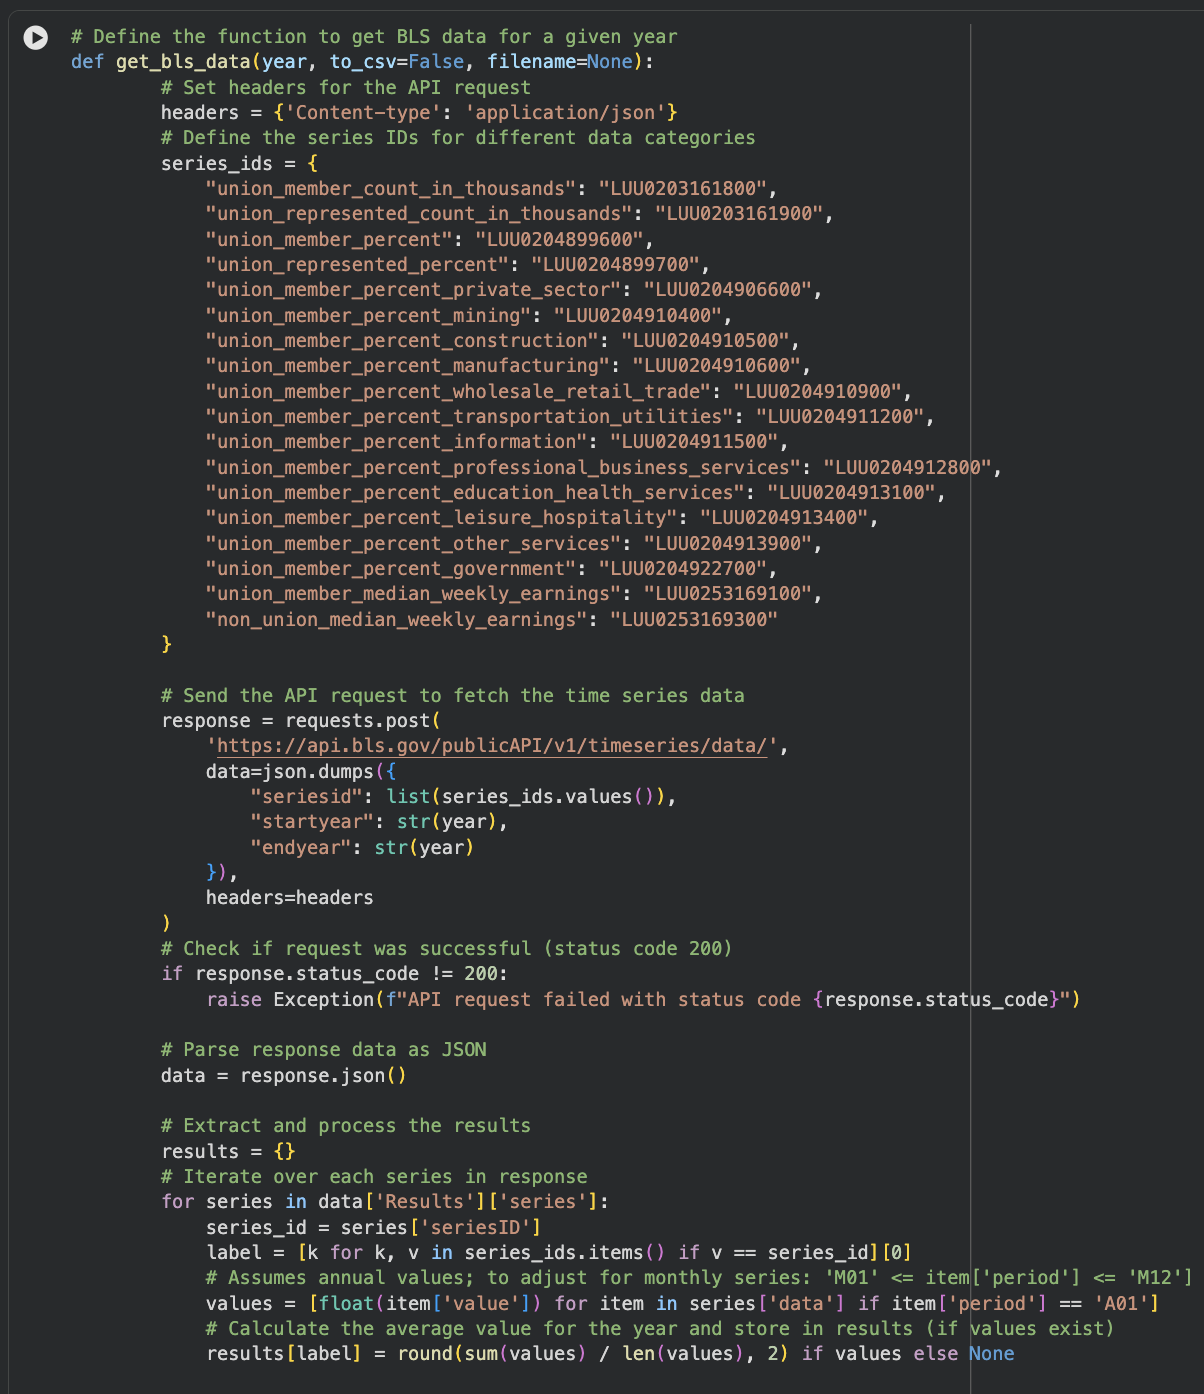
Get-bls-data — references specific series IDs from the BLS and returns the corresponding data points.
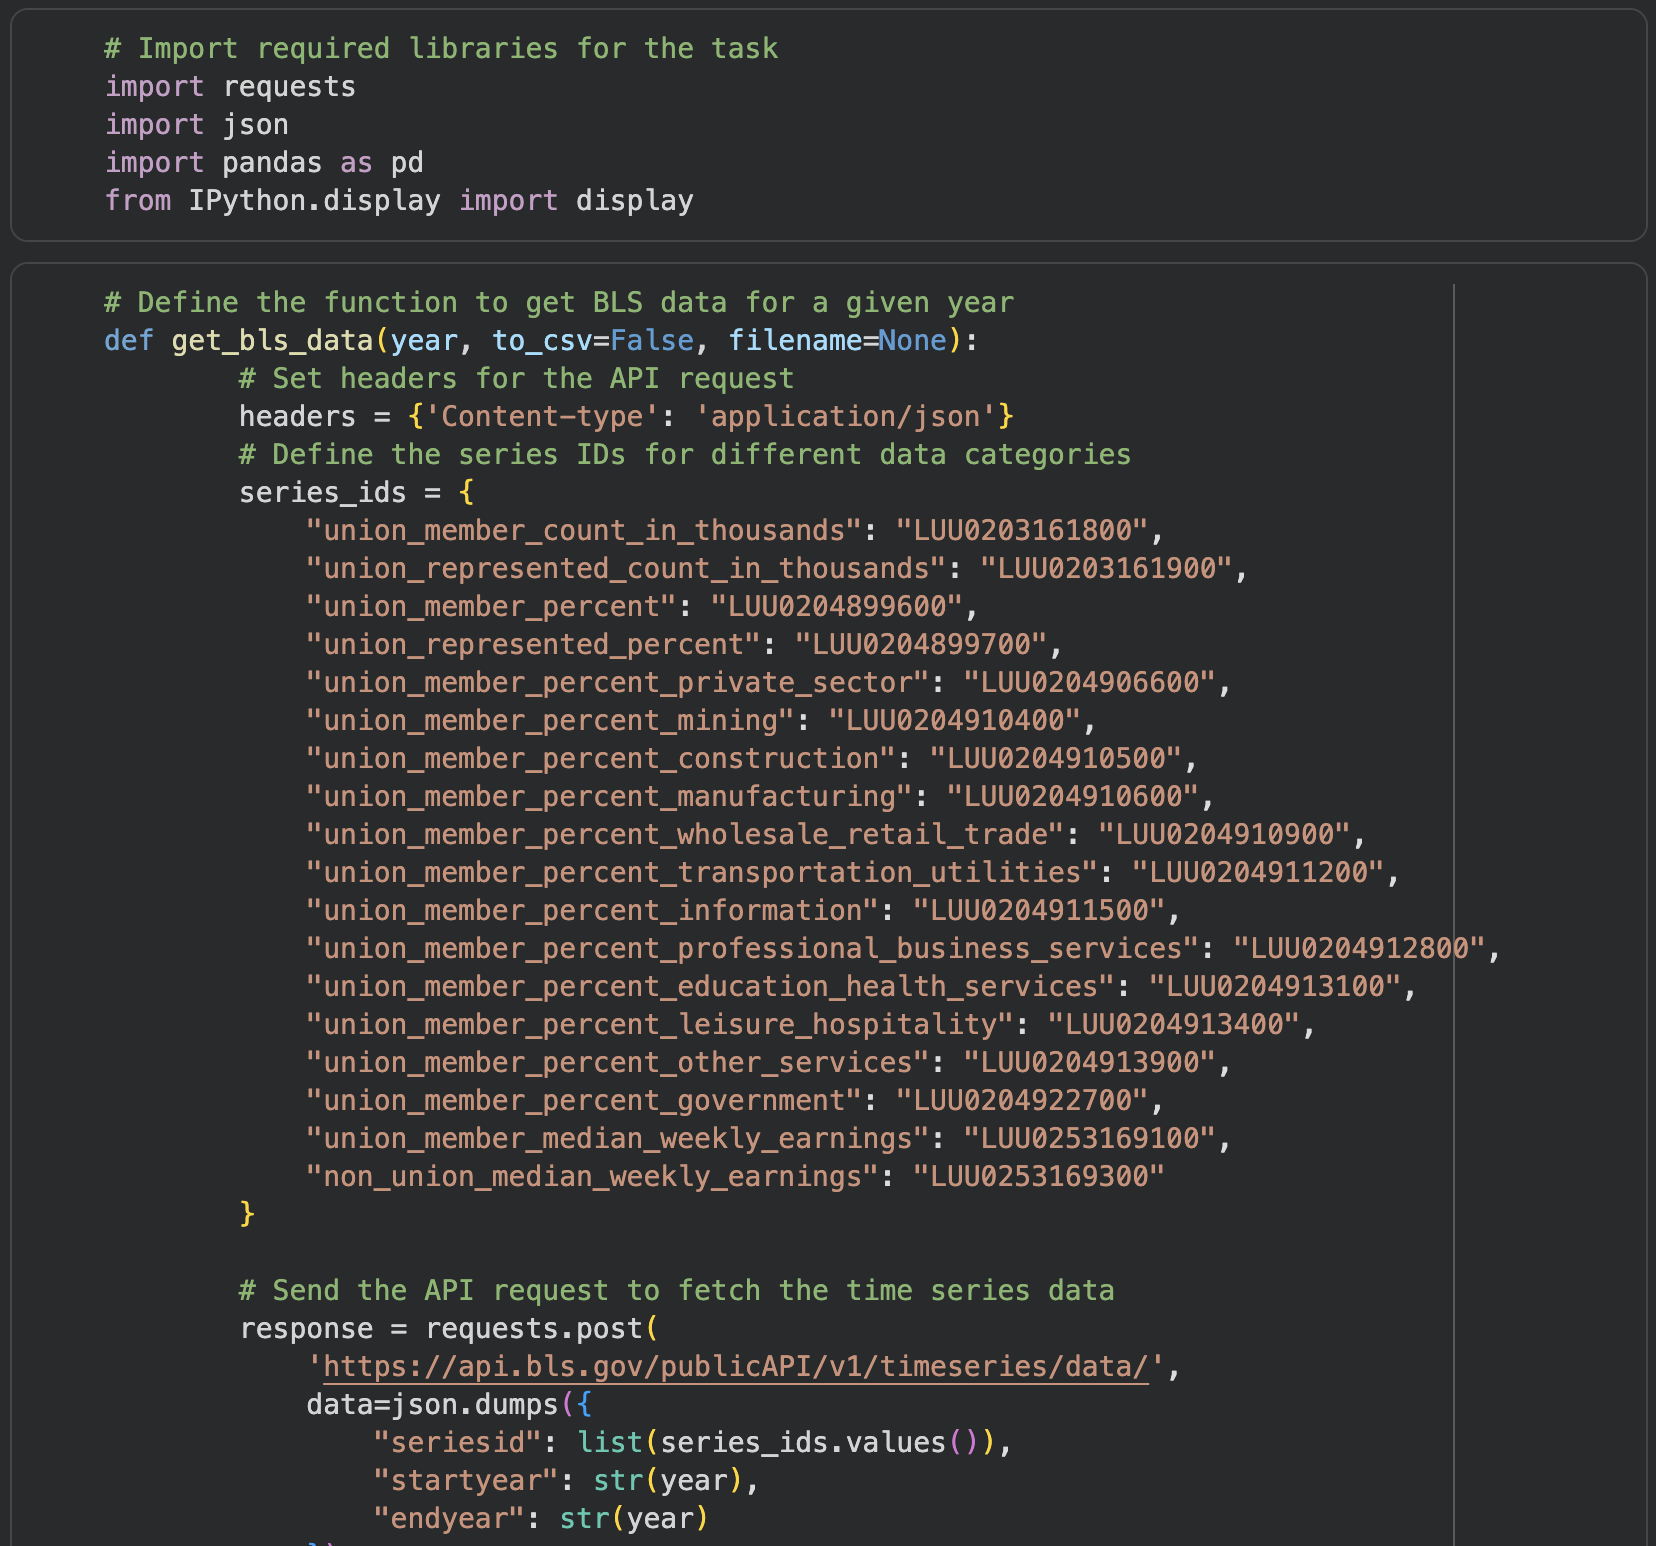
get-bls-data
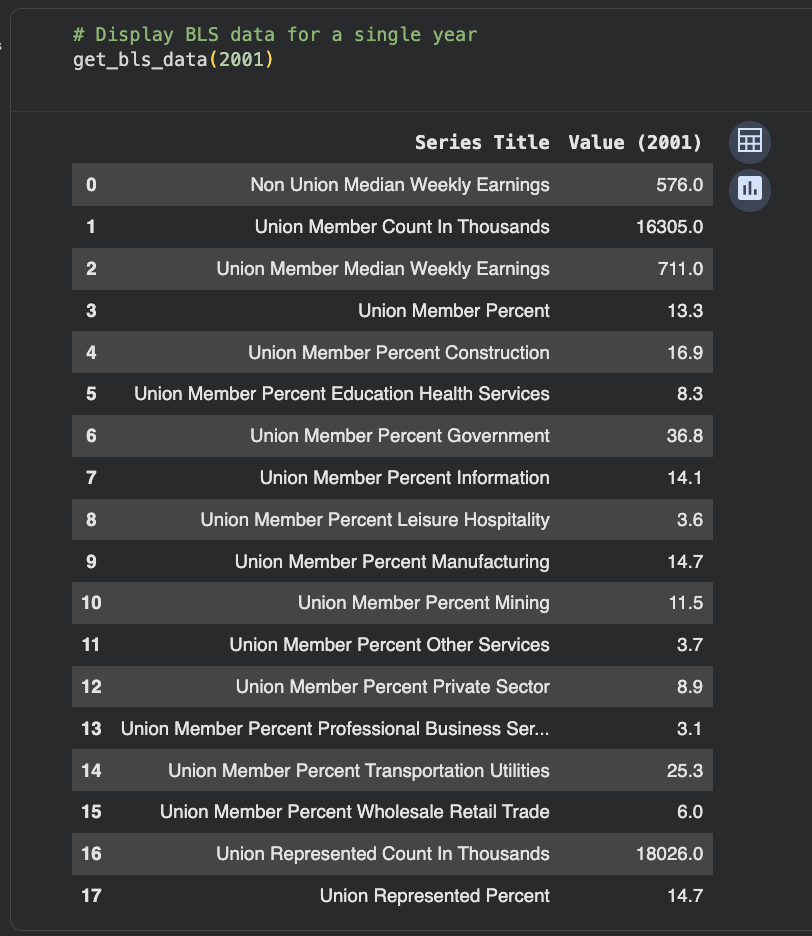
A user enters a year, the function displays the data for that year.
03 Challenges
Accessing APIs
As someone relatively newer to Python at the time of the project, the sample code available on the BLS Developer’s site appears simple, but there is zero annotation / are zero comments around what lines of code are performing what operations.
I know what the code is doing, however, personally, thorough documentation is extremely helpful (read: necessary) for truly understanding how it can be leveraged in my own work. This lead to a rabbit hole of research into existing BLS API usage examples (shout-out to the creators):
Running through some of the samples/code provided at the resources found was excellent practice and helped a bit in terms of general understanding of BLS API functionality; however, many were either over my head in terms of my Python experience at the time of this project, or a bit too specific in functionality to be useful when ideating my own function.
Returning to square one, I committed to working with the sample code from the BLS developer site and worked with it until I got it to successfully run.
Identifying Desired Series
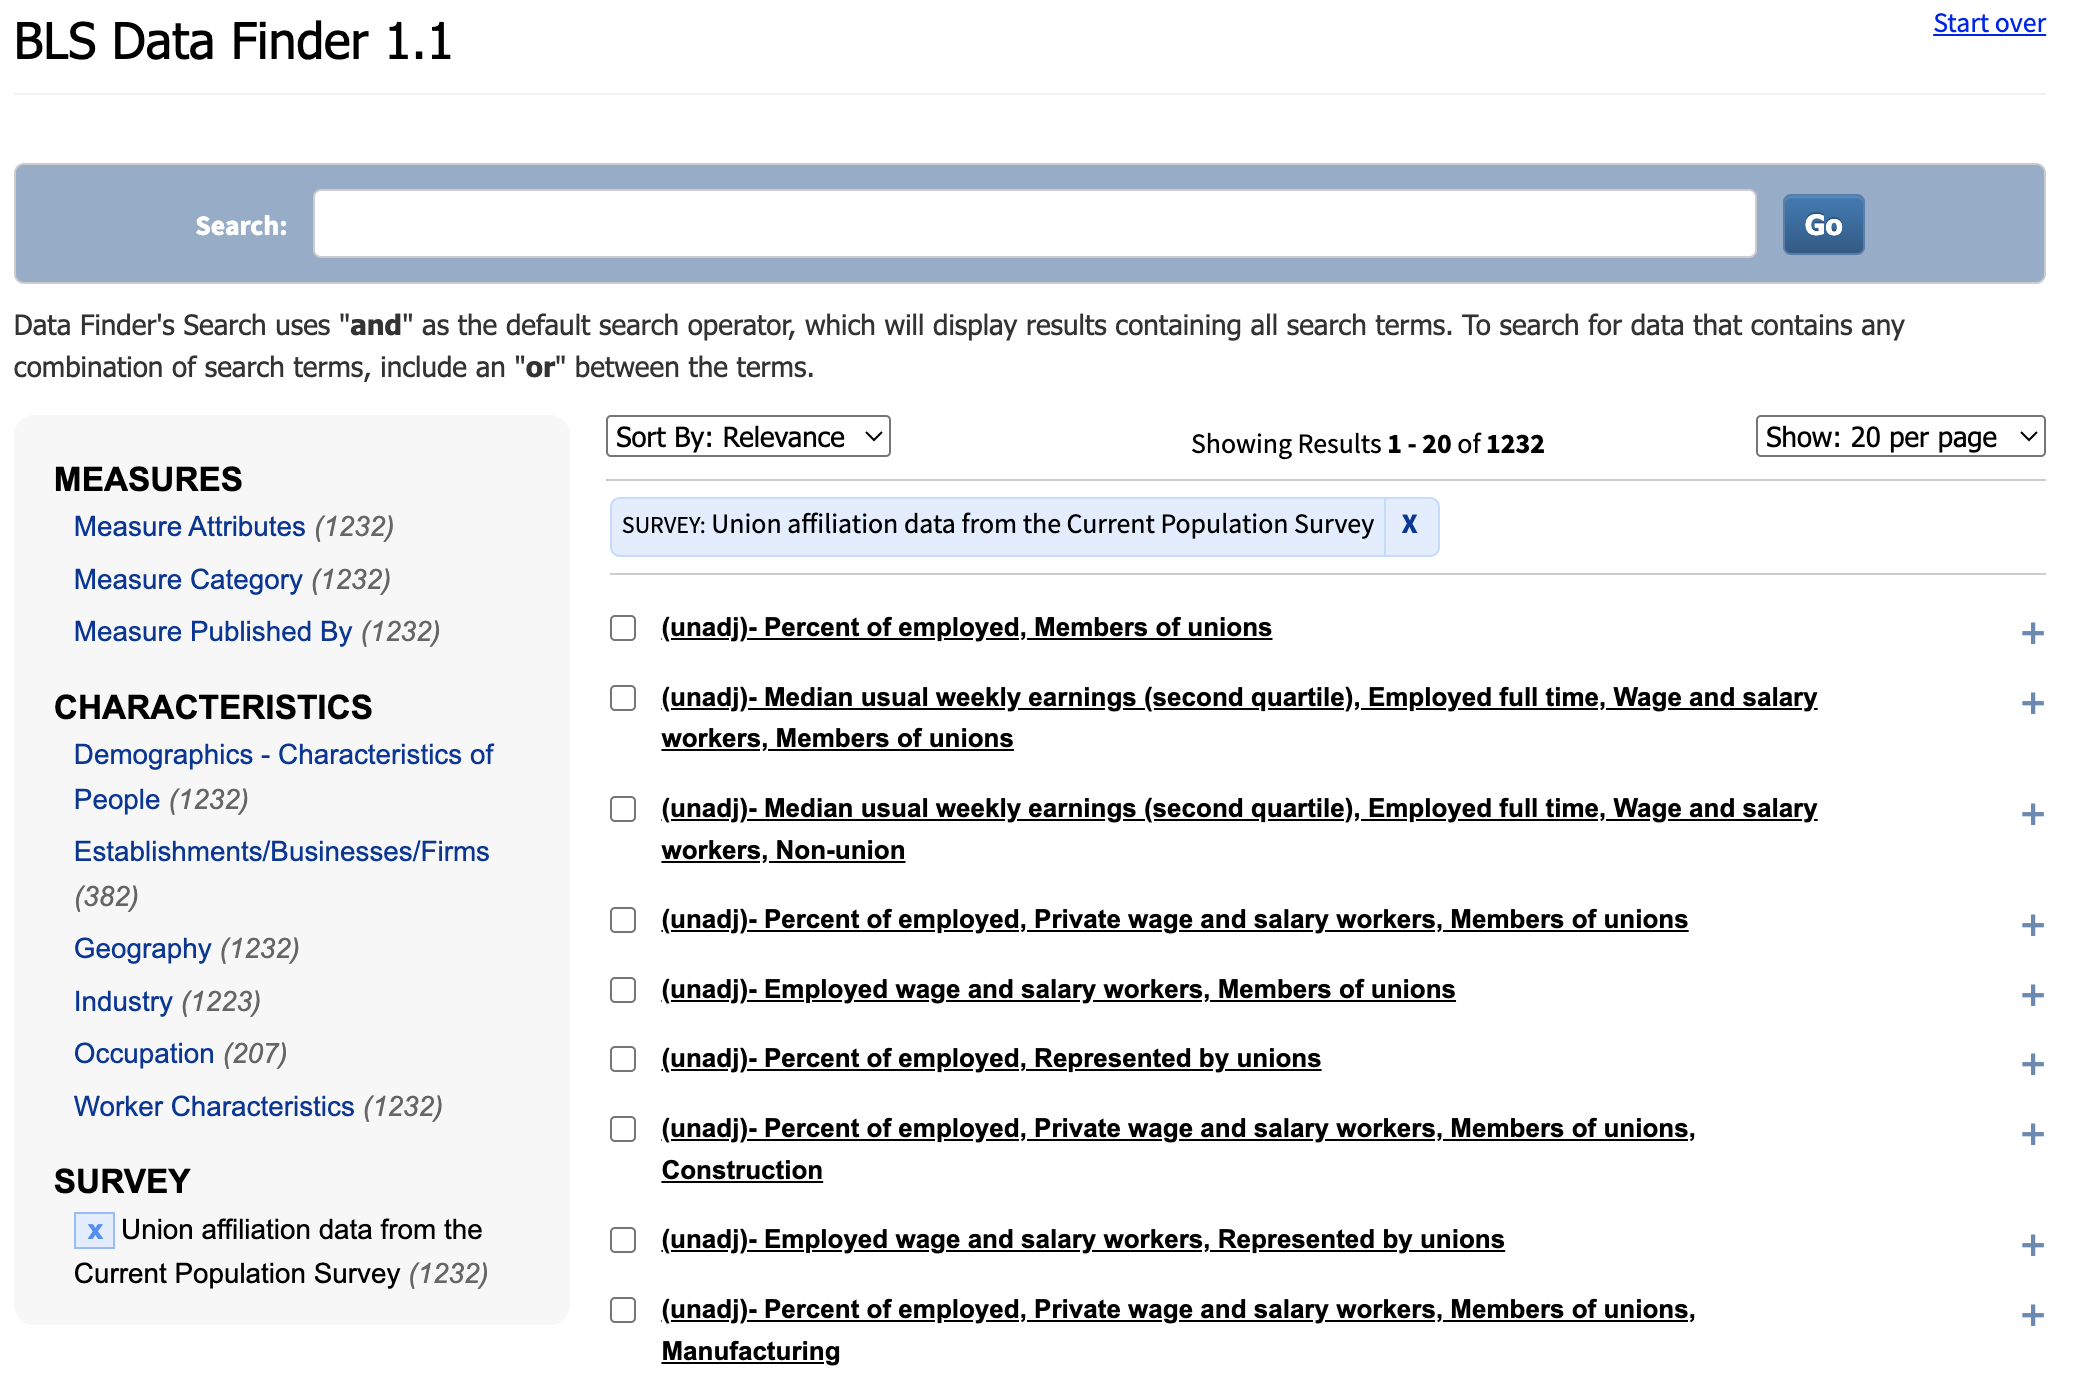
BLS, unlike the U.S. Census Bureau, for example, does not offer a key to its series IDs – it outlines the formats of the IDs for various categories of data and it’s up to the user to put them together in what is, hopefully, the correct combination. Through various web searches and exploration of BLS data tools, I eventually identified my target series IDs for use in my function: Union Affiliation Data from the Current Population Survey offers a list of approximately one dozen or so union- and employment-related data series.
Understanding Data Structure
A good portion of time spent troubleshooting came down to understanding BLS series IDs and general data structure. It was through this process I discovered the variance between “annual” and “monthly” data across different series: using BLS’ Series Report tool, I was able to gain a better understanding of the data structure to help inform my function.
04 Reflections
Limitations of the function
As-is, the get-bls-data function is limited to fetching data for the series explicitly included in the code, for a given year. However, I believe it’s set up in a such a way that it would be relatively simple to plug in other desired series IDs.
Basis for statistical analysis
I could also envision the function as a starting point for basic statistical analysis and visualization: for example, calculating the average labor union membership rate from 2020-2024, or visualizing trends in membership rate across a given period of time.
Framework for other databases
Not all databases were created equal, so while get-bls-data certainly is not a one-size-fits-all data access solution, it could potentially be used as a framework for working with other public APIs.
A “Hail Mary” fix
After nearly two and a half weeks troubleshooting the “extract and process the results” section of my function, I realized I wasn’t accounting for different date formats in the data – a tweak in a short line of code saved me – I could then “relax” and hone in on testing and adding finishing touches to the codeThis is a frequently asked question?
Coding in plain language
Thinking about what I wanted to accomplish in plain language, then translating that to programming language, activated new avenues among my usual problem-solving process, improving the learning experience as a whole.